Math Is Fun Forum
You are not logged in.
- Topics: Active | Unanswered
#1 This is Cool » Ellipse Whirl » 2019-01-20 01:16:56
- benice
- Replies: 2

References:
1.Nested Ellipses (Ellipse Whirl)
2.Whirl
#2 Re: Help Me ! » A line is neither concave up nor concave down. what is that line » 2018-08-05 15:23:03
Definitions of convex and concave functions (Wikipedia):
︶ Convex (= convex down = concave up) function
︵ Concave (= convex up = concave down) function
According to the definitions above, we have:
1. All non-vertical lines (y = ax + b) are both concave up and concave down;
2. A vertical line (x = c) is neither concave up nor concave down.
#3 Re: Computer Math » Calculating Pi » 2018-06-17 06:49:47
pione = pione + 1/double(sone);
pitwo = pitwo - 1/double(stwo);
#4 Re: This is Cool » Funny Boxer Equation » 2016-10-13 18:31:33
#6 Re: Computer Math » Geogebra Help » 2014-11-21 04:55:17
It seems that there are no available scripting commands for axis ticks.
You may change the axes ratio or the zoom-in scale dynamically.
See this page for some examples.
Sometimes cheating is good:
#7 Re: Help Me ! » Is there such a function? » 2014-11-12 08:48:25
Speaking of which, here is a question.
Does every non-constant periodic function have a smallest positive period?
Let f be the function defined by f(x) = 1 if x is rational and f(x) = 0 if x is irrational.
Then every rational number is a period of f.
#8 Re: This is Cool » Tracing a Function » 2014-06-29 15:26:00
What is your favorite color?
The color of fresh air.
By the way, do you use Sage and POV-Ray tracer?
No, but I know Sage and POV-Ray are great free tools.
How do you trace the curve in order to plot the distances corresponding to θ?
I don't need to trace the curve in order to plot it. The software do the work for me.
If you use Graph or gnuplot, you can see this page for examples of parametric plots.
Graph can help you trace parametric curves. Select the parametric function you want
to evaluate or trace, and then press Ctrl+E. See this page for more details.
#9 Re: This is Cool » Tracing a Function » 2014-06-26 03:16:16
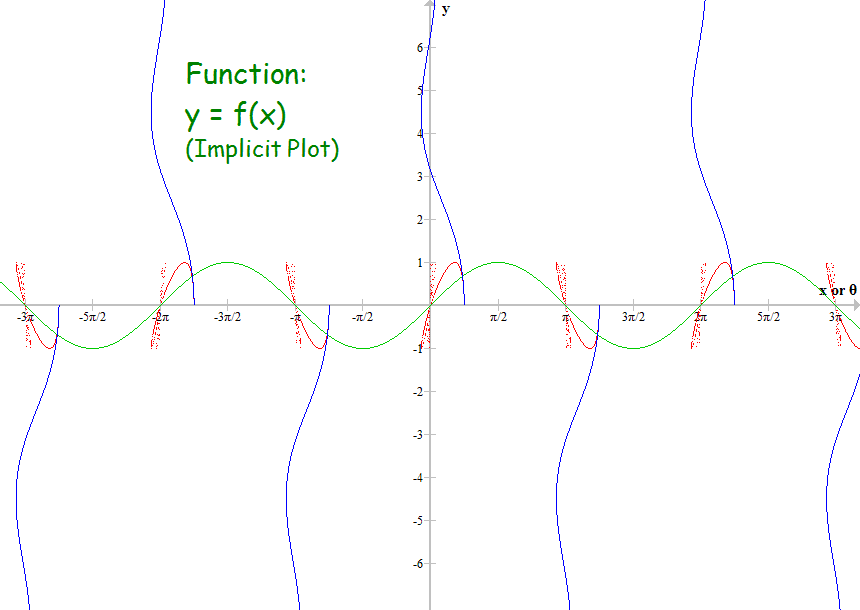
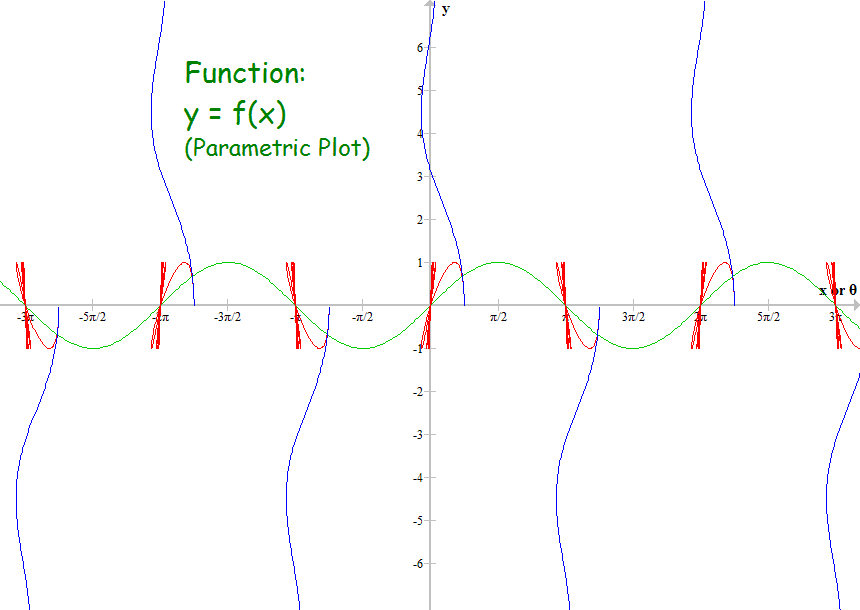
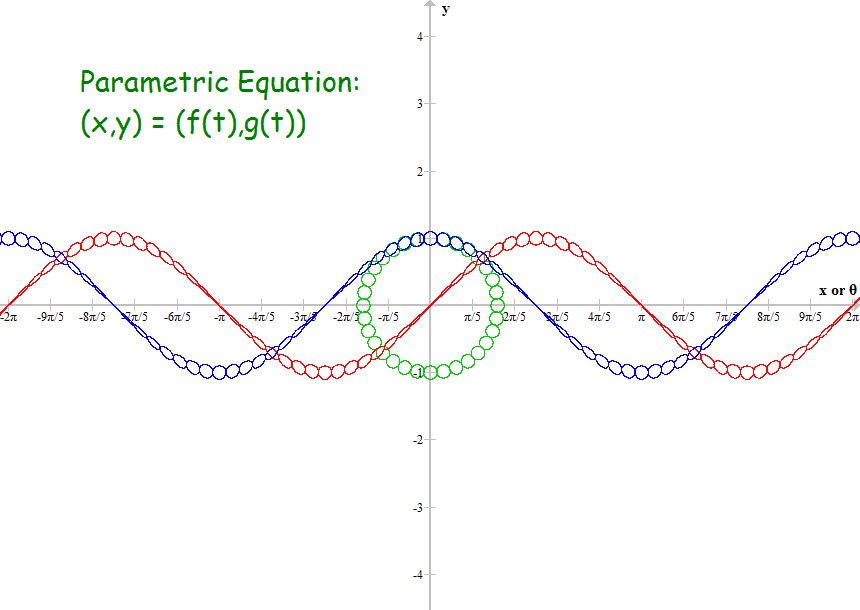
Did you plot both y with θ and x with θ? For example, in your first plot, the blue curve was the distance along the x axis for corresponding values of θ, and the red curve was for distance along y axis?
Yes, blue for x and red for y.
The function used in the first two plots is y = sin(x).
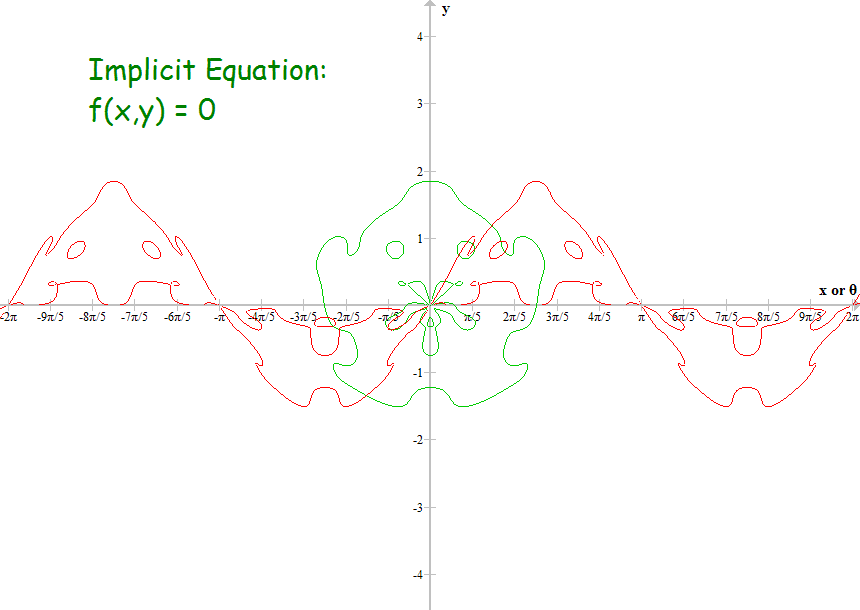
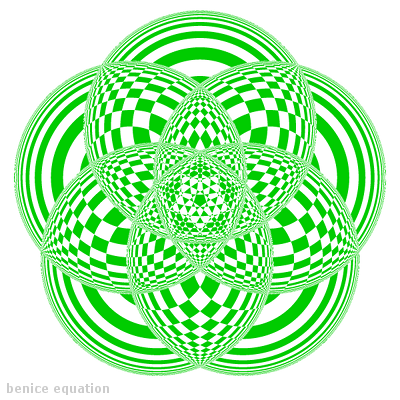
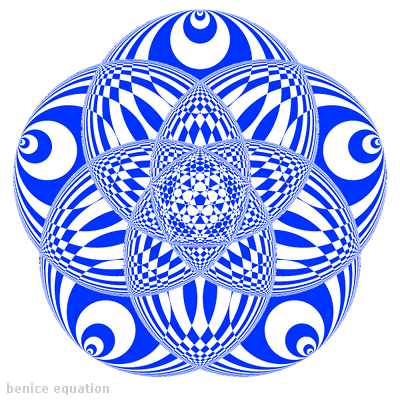
The equation of the monster in the third image is here.
The ring of green circles in the last image can be expressed as follows:
x = cos(t-mod(t,s)) + r*cos(n*mod(t,s))
y = sin(t-mod(t,s)) + r*sin(n*mod(t,s))
r=0.1, n=32, s=2*pi/n,
t=0...2*pi.
#10 Re: This is Cool » Tracing a Function » 2014-06-26 00:20:40
However, they can still be drawn. Are you able to have a computer draw these?
Case 1: Polar functions r = f(θ)
Use a function grapher to plot
y = f(θ)*cos(θ) in θ-y plane.
Case 2: Implicit equations f(x,y) = 0
Use an implicit equation plotter to plot
f(y*cot(θ), y) = 0 & y/sin(θ) > 0 in θ-y plane.
Case 3: Parametric equations (x,y) = (f(t),g(t))
Use a parametric curve plotter to plot
(θ, y) = (atan2(g(t),f(t)), g(t)) in θ-y plane.
Case 4: Functions y = f(x)
Let g(x,y) = y - f(x) and see Case 2
or let (x,y) = (t,f(t)) and see Case 3.
All these cases can be done using Graph or gnuplot.
#11 This is Cool » Infinite Families of Circles » 2013-11-28 03:58:50
- benice
- Replies: 1
(A) Concentric Circles

Regions enclosed by an infinite family of concentric circles.
Regions enclosed by five infinite families of concentric circles. (Animation Pictures)
(B) Tangent Circles

Regions enclosed by an infinite family of tangent circles.
Regions enclosed by five infinite families of tangent circles. (Animation Pictures)
#12 This is Cool » Tiling by Nested Polygons » 2013-07-04 16:55:23
- benice
- Replies: 4
Nested polygons generate logarithmic spiral curves and are good examples of contraction mappings.
We can use nested polygons to tile the plane and get beautiful tessellations:
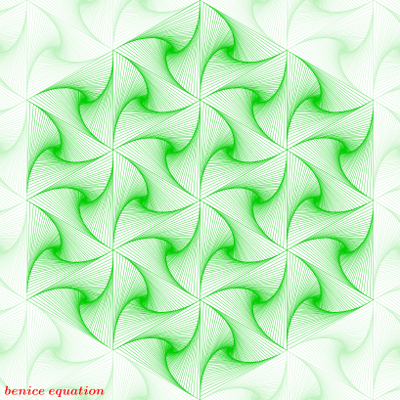
These pictures are very easy to make using GeoGebra.
More tessellations and a few GeoGebra examples are here.
#13 This is Cool » Fractal Spacetree » 2013-01-23 08:40:09
- benice
- Replies: 6
People kill too many trees!
A mothertree is coming, and she will revenge her dead children.
------> Fractal Spacetree
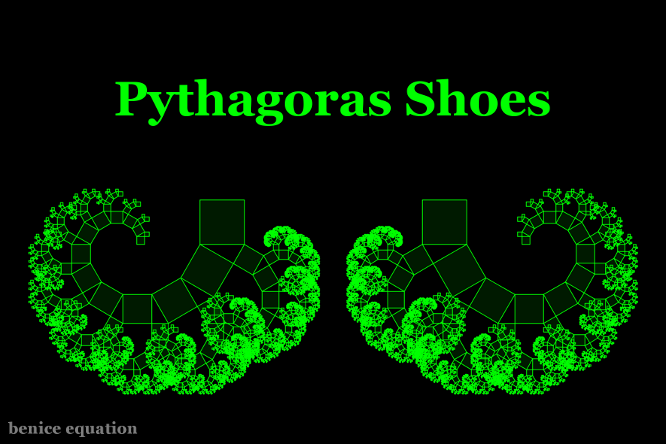
#14 Re: This is Cool » I stole Pythagoras's shoes! » 2013-01-23 08:29:48
Hi All;
Thank you for your appreciation.
I am the almighty Pythagoras! Give me back my shoes.
Ha! ha! you can't beat me!
I am a Super Saiyan now!
#15 This is Cool » I stole Pythagoras's shoes! » 2013-01-11 20:52:40
- benice
- Replies: 51
#17 This is Cool » Star Fractal using GeoGebra » 2012-12-21 09:07:26
- benice
- Replies: 4
#18 Re: This is Cool » Can you find any faces in the picture? » 2012-11-05 04:58:44
Hi benice;
Hi bobbym;
You are great! I found 5 faces at (11,10), (17,10), (42.5,10), (4.5, 4), (11,4).
The one at (17,10) is much like a cartoon face. (Here is the enlarged picture.)
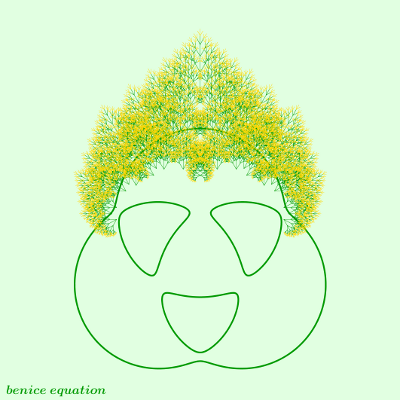
#19 This is Cool » Can you find any faces in the picture? » 2012-11-05 04:11:16
- benice
- Replies: 3
Can you find any faces in the picture below?
#20 Re: Help Me ! » Plot functions defined on rational numbers and irrational numbers » 2012-09-25 10:36:34
How did you generate your points, did you use a farey sequence too?
Hi,
I used the GeoGebra command 'Sequence' to generate those points:
Sequence[Sequence[(p/q,GCD[p,q]/q),p,1,q-1],q,2,300] .
Do you have a rationalize command in the language or grapher you are using? If you do then there is a way
I have downloaded Maxima 5.28 (which has a rationalize command), but I have no idea how to do that.
Yesterday, I constructed an approximate method which can plot the graph of y = f(sin(x)) directly.
( See this page for some examples. )
Thank you for your help bobbym!
#21 Help Me ! » Plot functions defined on rational numbers and irrational numbers » 2012-09-21 22:41:46
- benice
- Replies: 3
Hi All,
Suppose f1, f2, and g are arbitrary functions of real variables.
Let
f(x) =
f1(x) if x is rational,
f2(x) if x is irrational.
What software can be used to define f(x) such that we can plot y = f(g(x)) directly?
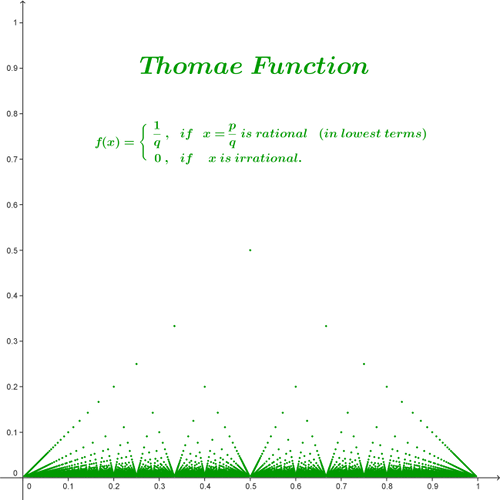
For example, consider the Thomae function:
f(x) =
1/q if x=p/q is rational, gcd(p,q)=1 and q>0,
0 if x is irrational.
How to define f as a function such that we can plot y = f(sin(x)) directly?
#22 Re: This is Cool » Church Function » 2012-08-27 19:50:26
Hi;
It is a question of scaling but this looks like the Empire State Building to me. I used n = 4.
Hi, thanks for the rescaled graph. The Empire State Building reminds me of King Kong.
Here are the graphs (for n=1~8) with equal scaling on the x & y axes.
#23 This is Cool » Church Function » 2012-08-26 16:29:38
- benice
- Replies: 3
Do you like church? Here is a church function:
#24 Re: Help Me ! » need this graphed so i can see what it is please » 2012-07-30 10:23:26
W I L D H O R S E S
#25 This is Cool » Monster Tessellation » 2012-07-22 23:43:16
- benice
- Replies: 1
The first frame of the above animation is derived from the tenth picture
in this page: Tessellation using Inequalities (1)